
How to trace an entity in the dashboard
See every API call and status change for a customer, paykey, charge, payout, or funding event on one timeline, and follow the connections between them.
What you can use Trace for
When a payment fails, the explanation is rarely on the payment itself. It is in what came before: when the customer was created, when the paykey was added, what changed along the way. Trace puts that sequence in one place.
Understand one customer. Follow a customer through every paykey, payment, and status change tied to them, without opening five pages to do it.
Find the root cause of a failure. Read the sequence that produced it instead of working backwards from the final status, and open the exact request and response that failed.
Before you start
You need an active Straddle Dashboard account with the Developer or Admin role.
Trace covers activity from the last six months. Older logs are cleared and will not appear.
Open Trace from an entity page
Open the detail page for a customer, paykey, charge, payout, or funding event.
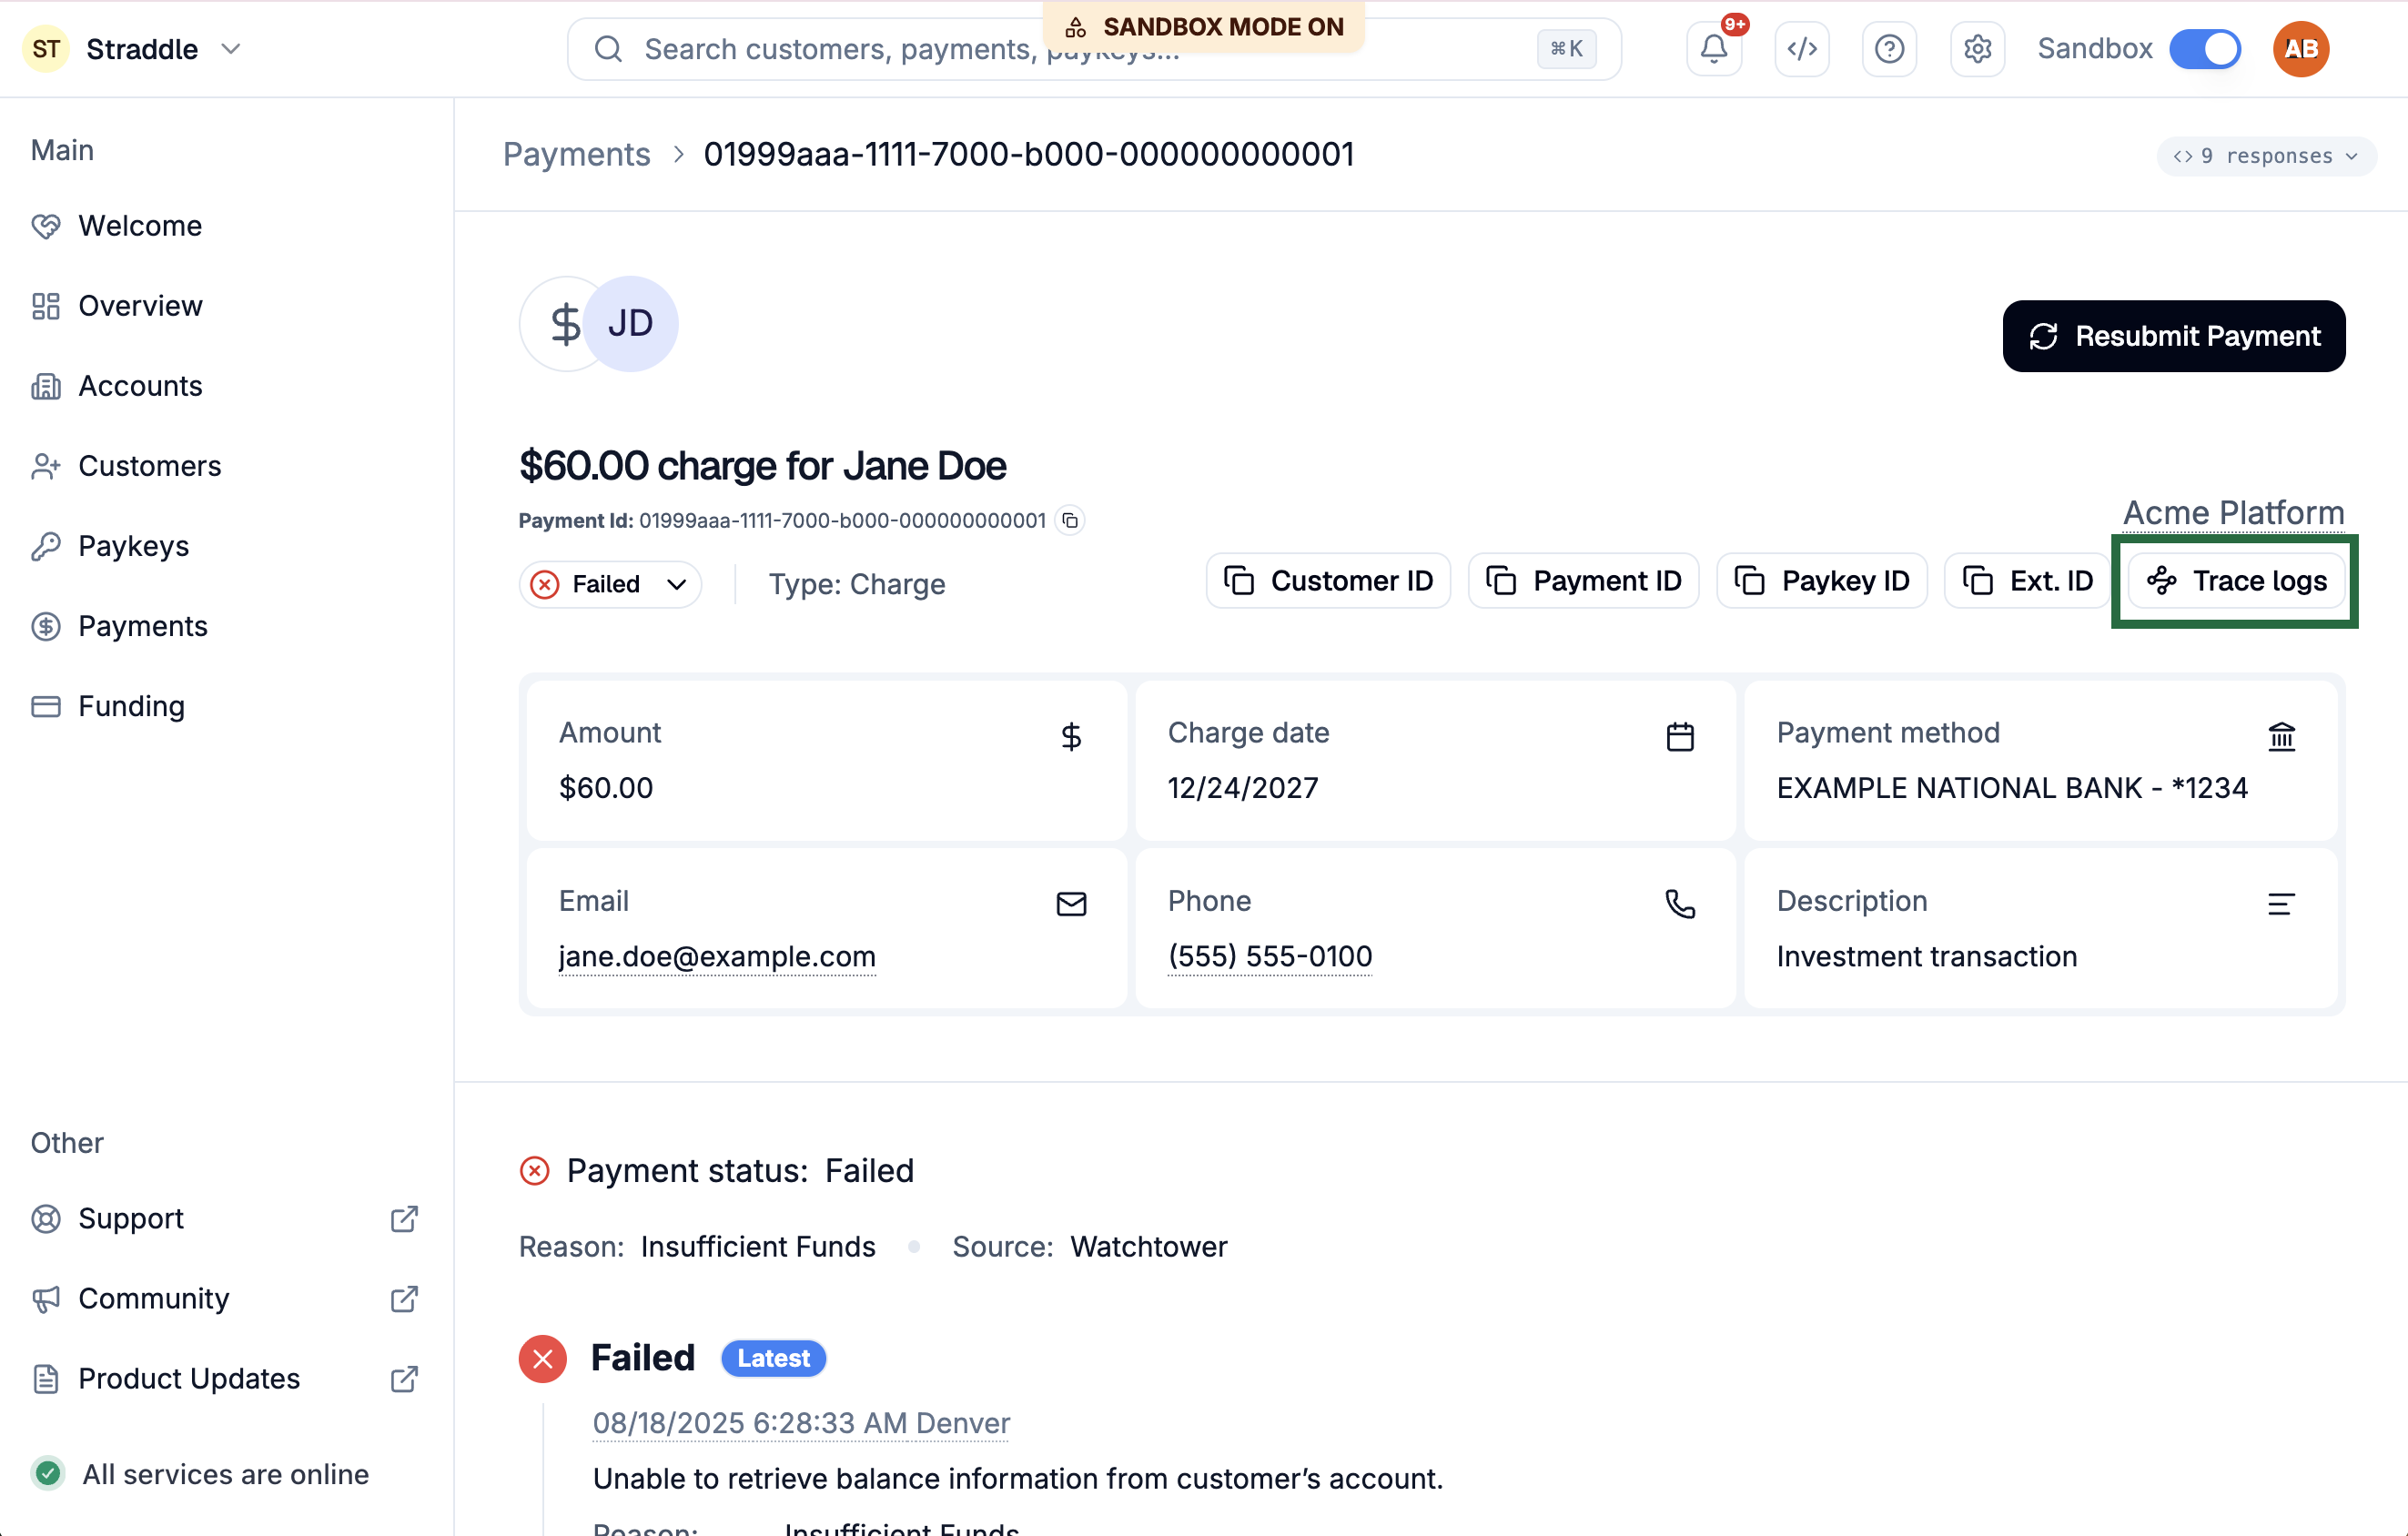
Click Trace logs, near the ID copy buttons at the top of the page.
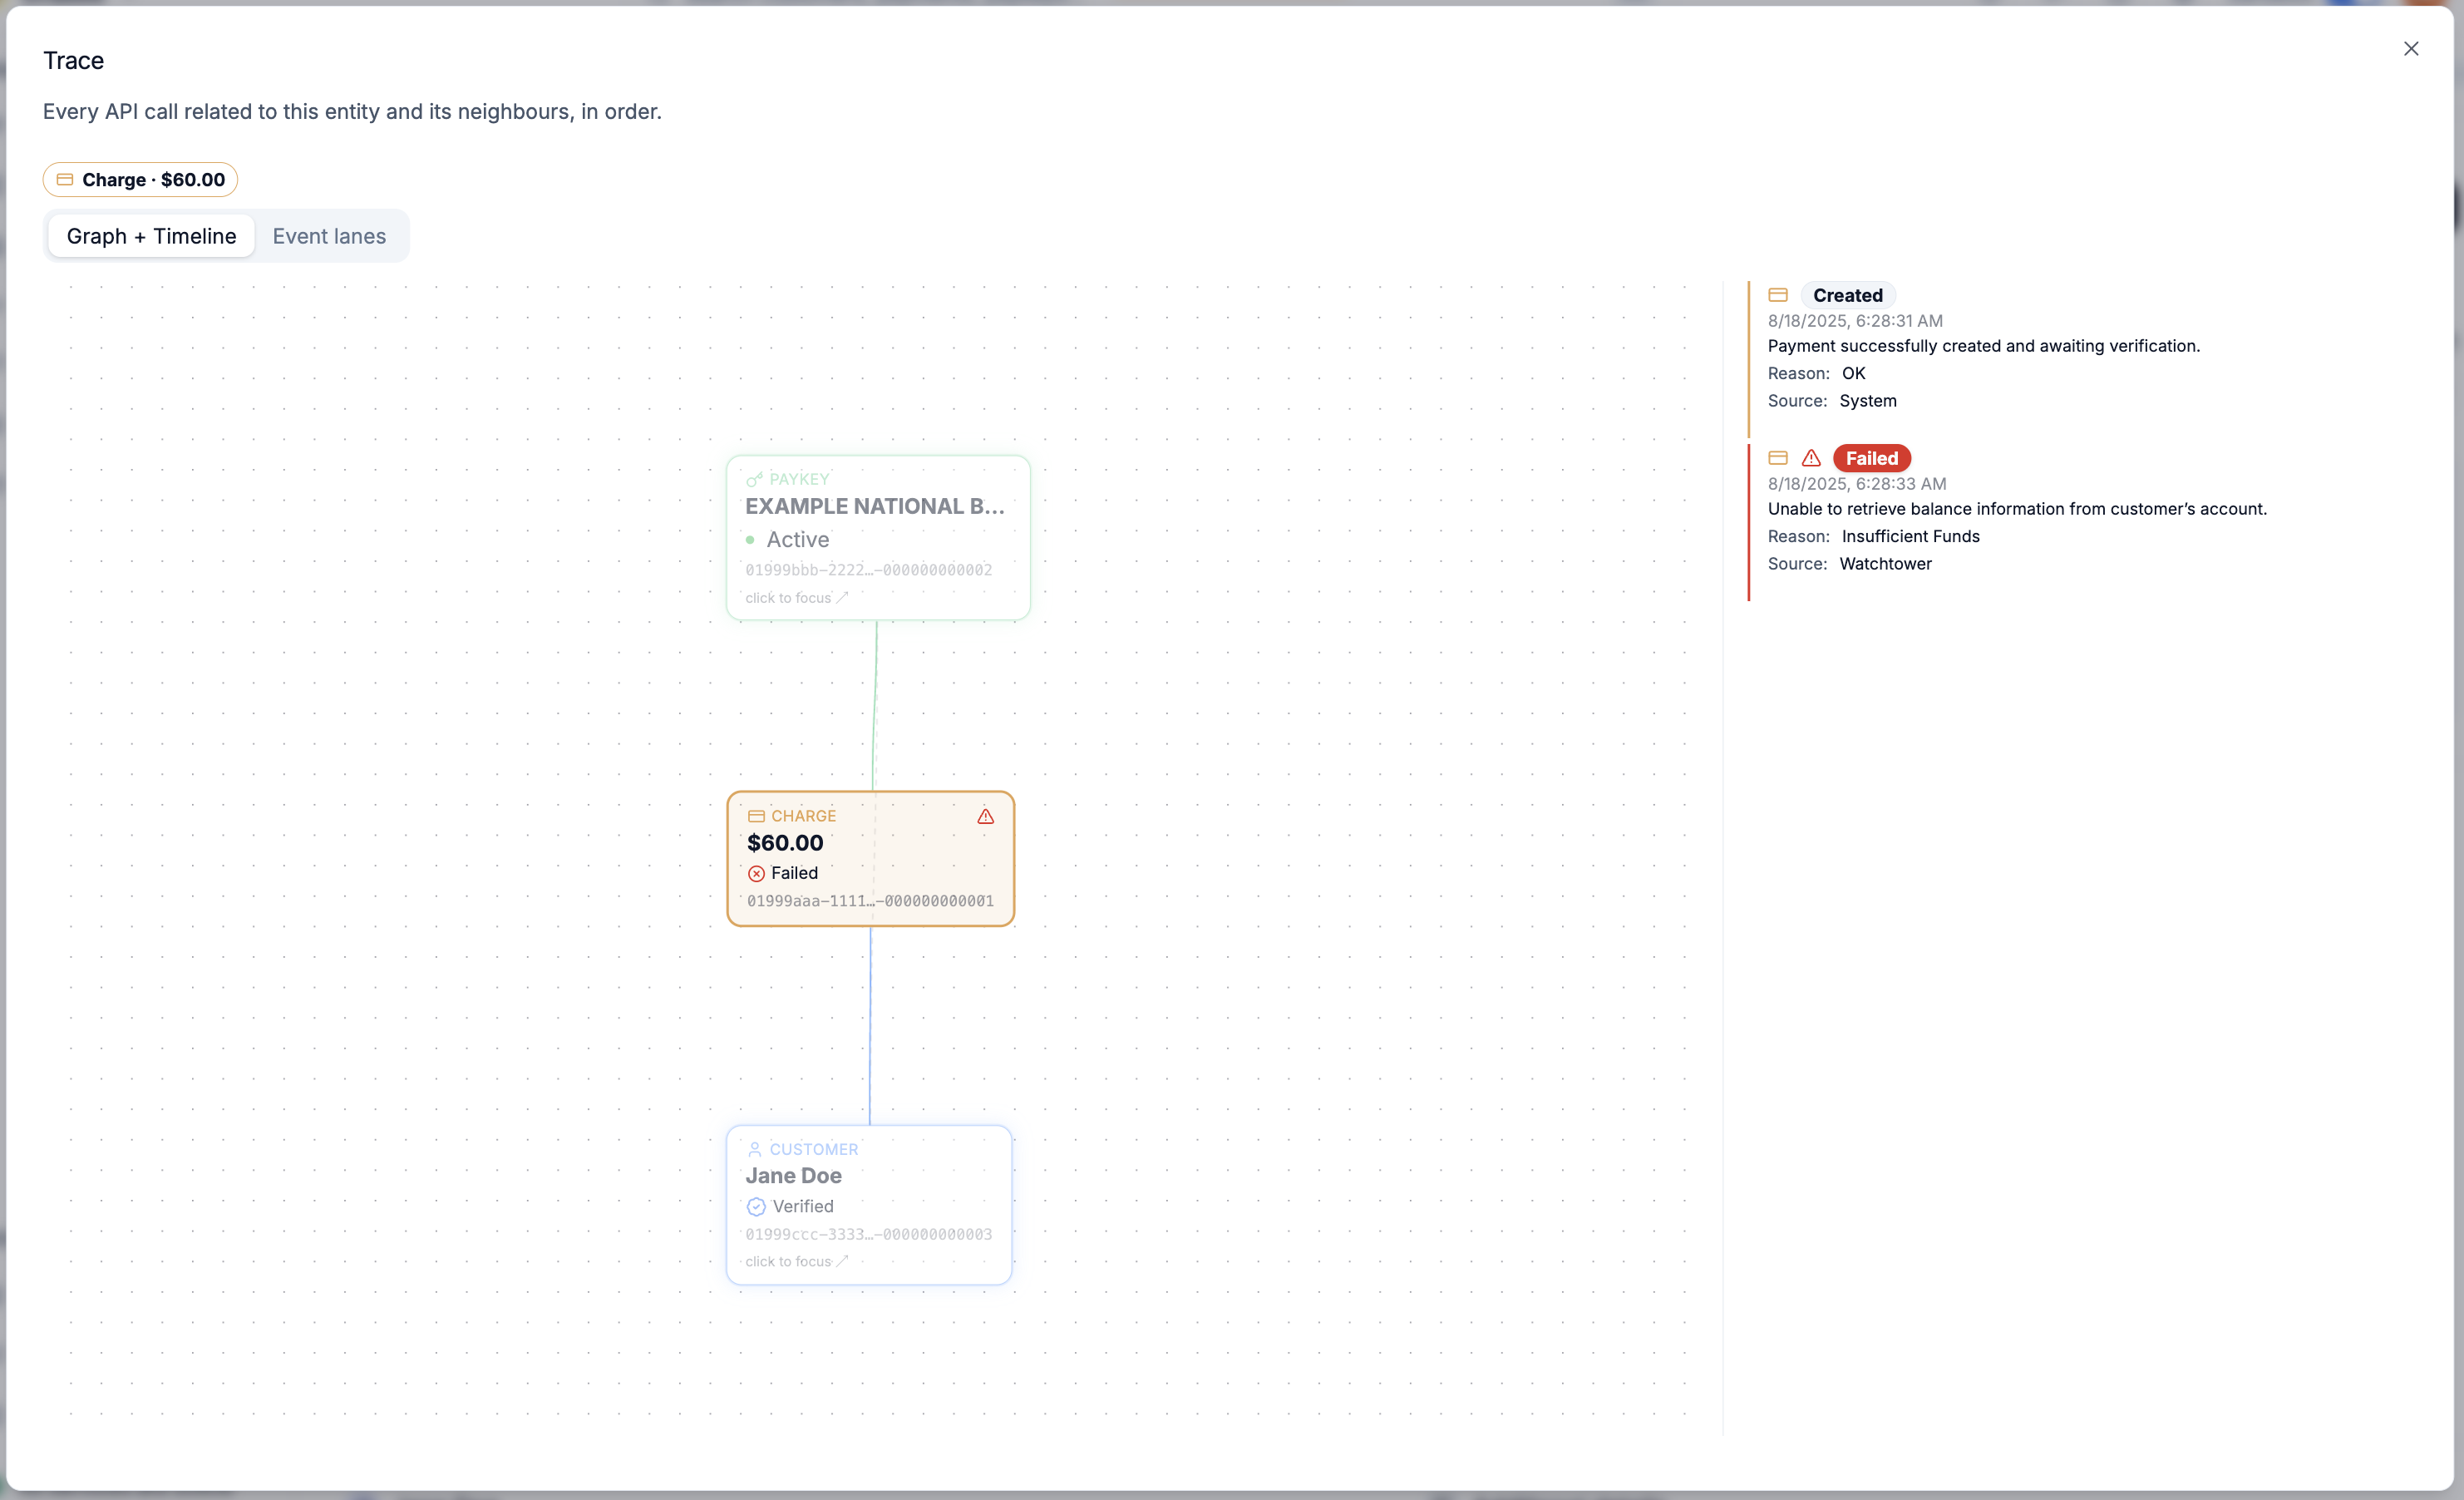
The Trace window opens focused on that entity, with the Graph + Timeline view selected.
Read the timeline
The timeline on the right lists everything that happened to the focused entity and its neighbours, oldest first. It contains two kinds of entry:
API calls, labelled by what they did rather than by their raw path.
POST /v1/chargesreads as Create Charge, andPOST /v1/charges/{id}/holdreads as Hold Charge.Status changes, shown as pills. Each one carries the reason, the message, and where the change came from, so a failure explains itself in place.
Click any API call to open its full request and response in a side panel. Rows are color-coded to match the entity they belong to, so you can tell at a glance whether a call acted on the charge, the customer, or the paykey.
Anything that failed is marked. A call that returned an error and a status in a failed state both count, on the row and on the matching graph node.
Explore the graph
The graph on the left shows the focused entity at the center with its immediate neighbours around it. A charge, for example, sits next to the customer who was charged and the paykey it drew from.
Click a node to re-center on it. Its own neighbours join the canvas, and the nodes already there stay put, so the picture builds up as you explore rather than resetting each time.
Drag a node to move it. Your layout is kept as you continue.
Use the breadcrumb above the graph to jump back to any entity you have already visited.
Hover a node to highlight its rows in the timeline.
Each card shows the entity type, a name or amount, its current status, and the tail of its ID.
Switch to Event lanes
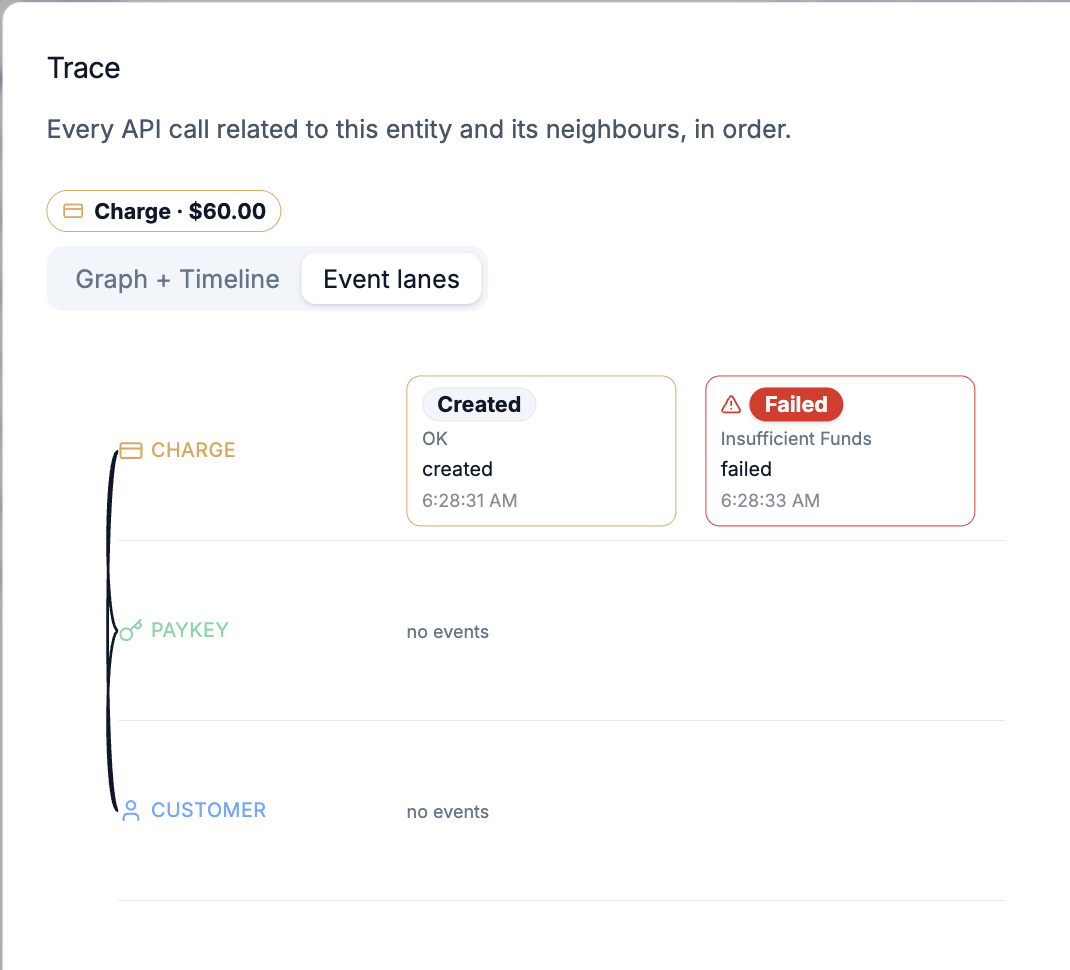
Select Event lanes for the same events arranged as one lane per entity on a shared timeline. Where the timeline answers "what happened next," lanes answer "which entity was active when," which makes gaps and overlaps easier to spot.
Trace from an ID instead
When you have an ID but not a page:
Open Trace from the dashboard navigation.
Paste a customer, paykey, charge, payout, or funding event ID, or type a name to search.
Pick a result, or press Trace to use the ID as typed.
Straddle works out which kind of entity the ID belongs to and opens the same view. If the ID is not recognised, you will see Unrecognized id.
What Trace includes
Trace shows:
API calls made with your API keys.
Status changes on the entity, with their reasons.
Trace does not show:
Read requests. Only calls that change something are recorded, so fetching a charge will not appear.
Activity older than six months.
Actions taken in the dashboard. Trace covers what your integration did through the API.
More than one connection at a time. The graph loads the focused entity's immediate neighbours. To go further, click through to the next entity, which loads its neighbours in turn.
Tips
Start from the thing that went wrong. Opening Trace on a failed charge puts the failure and everything that led to it in one place.
If a customer has several payments, trace the payment rather than the customer. You will get a tighter picture of that specific attempt.
The side panel showing a request and response stays open as you scan the timeline, so you can compare two calls without losing your place.